
Simple to create and modify dashboards
Dashboards are created and modified using the free and open source Inkscape image editor. Inkscape works on Windows, OS X and Linux.
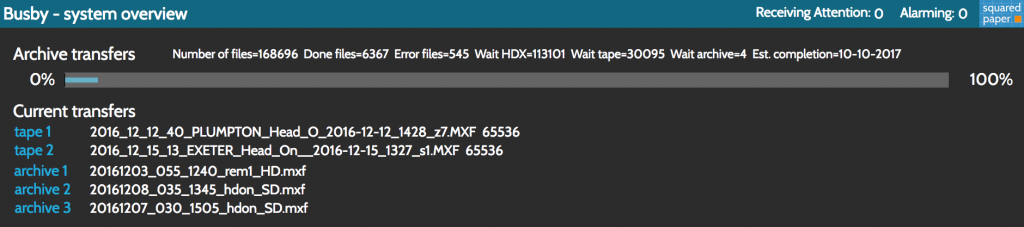
Easy to update display data
All Busby services have the ability to send out a special kind of ESB message called a display update message. Values are sent along with keys that identify fields in the SVG drawing which was made in Inkscape. Displays are automatically updated with no need to refresh the page, and Busby dashboards works with most web browsers, making Busby dashboards ideal for control room monitor stacks.
Busby dashboards can also be updated by non Busby services, using our command line tools, which are supplied with all Busby systems. This makes it quick and easy for engineering staff to update in house developed scripts to allow them to update Busby dashboards.
Built in components
Busby dashboards ships with several built in display components, meaning all you need to worry about is the look and feel of the dashboard, and which fields you want updating. Built in components include: